News Release: Latest data shows UK office occupancy reaching new pandemic highs.
Latest data shows UK office occupancy reaching new pandemic highs.
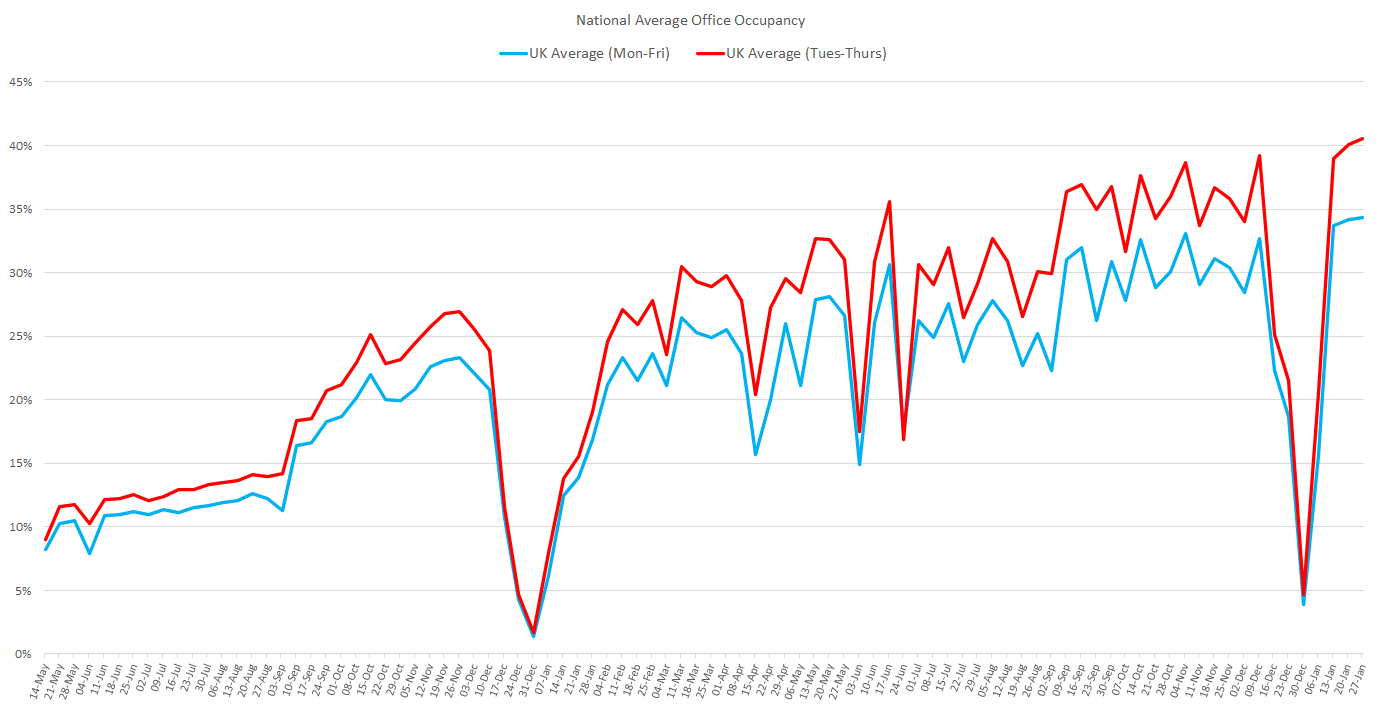
- National weekly average of office occupancy reaches 34.3%
While the average number of staff working from their offices got off to a slow start in January, the latest research from Remit Consulting reveals a strong bounce back in the second, third and fourth weeks of the month, with the week ending Friday the 27th recording a national average of office occupancy of 34.3% - the highest figure since the start of the firm’s Return survey in May 2021.
The latest report from Remit Consulting confirms the established pattern of higher office attendance from Tuesday to Thursday, with occupancy over the middle three days of the week now regularly pushing 40%.
“Despite rail strikes, occupancy levels in January 2023 were stronger by a sizeable margin than twelve months previously, when the country was dealing with the Omicron variant of Covid-19,” said Lorna Landells of Remit Consulting.
In London, the West End experienced a weekly average occupancy rate of 43.9% last week. At the same time, the weekly average for the Docklands submarket reached 49.4%.
"This is a dramatic improvement for an area of London which has previously held a position behind the West End. Perhaps the preponderance of banking institutions has begun to play its part," added Lorna Landells.
There are diverse views in the property sector regarding what constitutes maximum occupancy for offices, with some industry commentators suggesting that, due to holidays, external meetings, staff sickness and other operational issues, offices were only ever 60-80% ‘full’ before the pandemic.
Previous research from the BCO suggested a figure of 60%, while other market practitioners suggest a figure of between 70% and 80% at peak times in the calendar, although this will have varied widely according to individual buildings and businesses. The graph shows an adjusted figure to compare current figures with a possible pre-pandemic “80% average office occupancy”.