News Release: Average UK office occupancy rates hit highest level since Lockdown
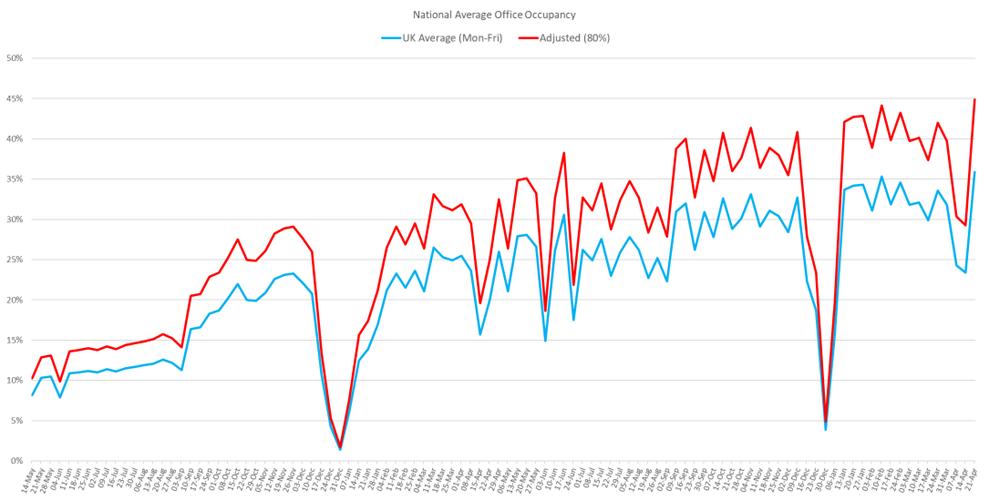
- National average office occupancy rate reached 35.9% in the week ending 21 April.
Office occupancy rates in the UK hit the highest level seen since the end of the national lockdown in March 2021, according to the latest research from Remit Consulting.
The management consultant’s Return report reveals that, in the week ending 21 April, the national average office occupancy rate reached 35.9%. Compared to possible average, pre-pandemic office occupancy rates of 80%, the adjusted figure suggests a rate of 44.9%.
Lorna Landells of Remit Consulting said "The number of people commuting and working in the office on a daily basis was heavily impacted by the double bank holiday over the Easter period, and on a monthly basis, the national average occupancy for the first three weeks of April was just 27.9%. However, post-Easter, occupancy levels recovered strongly to reach the highest level since our survey began, and only the second time it has exceeded 35%.
"Last week, the overall figure for London was held back by weakness in Midtown and other submarkets, but the West End reached a weekly average of 47.6%. In Scotland, Edinburgh recorded a solid 32.4%, but Glasgow continued to lag with an office occupancy rate of just 16.3%," she added.
Tuesdays, Wednesdays and Thursdays remain the busiest days of the week for people in the office, according to Remit Consulting, and last week, the national average office occupancy exceeded 40% on these three days.
There are diverse views in the property sector regarding what constitutes maximum occupancy for offices. Some industry commentators suggest that, due to holidays, external meetings, staff sickness and other operational issues, offices were only 60-80% ‘full’ before the pandemic.
Previous research from the BCO suggested a figure of 60%, while other market practitioners suggest a figure of between 70% and 80% at peak times in the calendar, although this will have varied widely according to individual buildings and businesses.
The graph shows an adjusted figure to compare current figures Monday - Friday.